Runalysis
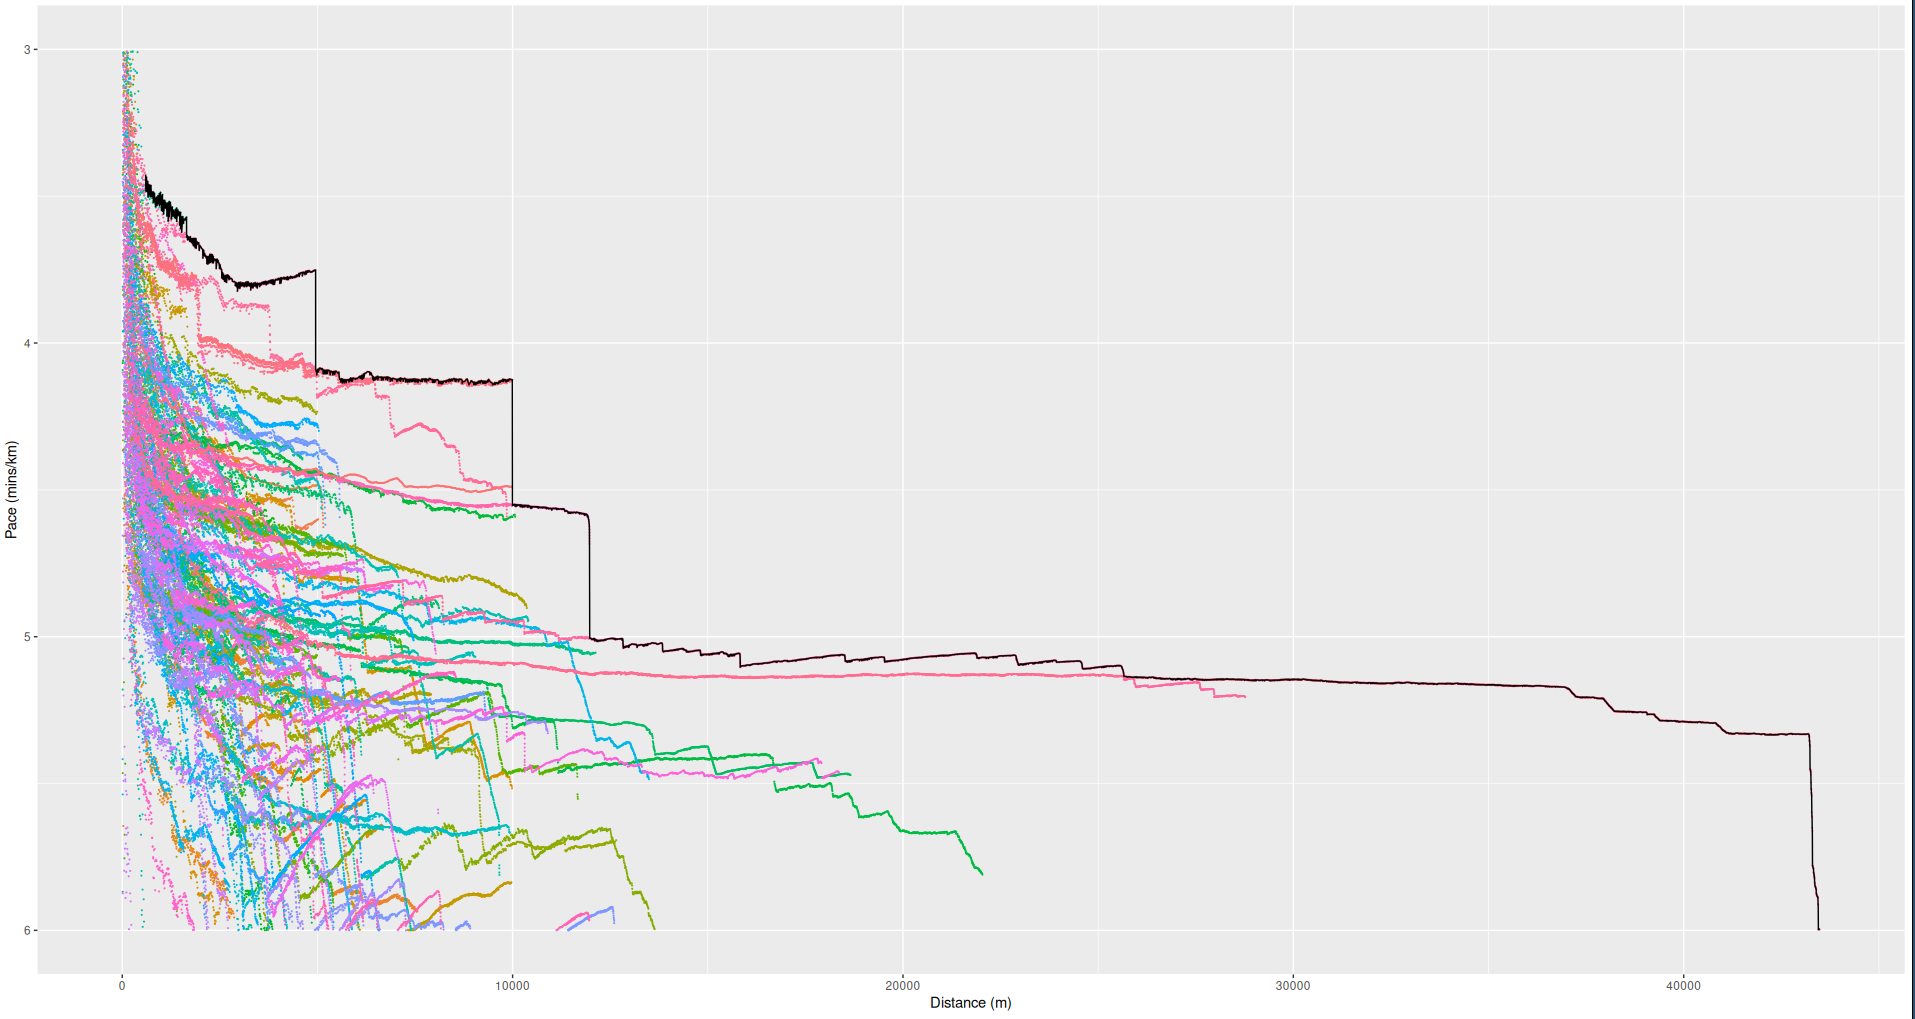
This graph is exactly how fast I have ever run.
I have been curious about the limits of my running ability for as long as I can remember. As someone who enjoys numbers more than I do putting on shoes and going out for a jog, the incentive to get a set of data after each one of my runs has been a major motivation in getting out and running at all. But applications like Strava only do a small amount of data analysis on your activities, and during the time that I used it, I often wanted to know whether I had run, say, a 1.5 mile section of my run faster than I'd ever run 1.5 miles before. Thus I learned the R programming language and took my data into my own hands. Here's a description of what I did.
1 - Retrieving My Data
At the time of my starting this project, Strava had no option to download all of your activities at once. I don't know if this is still the case or not, but there is only the option to download one activity at a time. I had already gone on many dozens of runs and bicycle rides at the time, and I didn't want to spend hours manually downloading each recording, so I wrote a Python Selenium program to log into my account and download all of my files automatically. I have no idea whether this is strictly within their terms of use or not, so I have chosen not to make my code public.
One thing that became apparent is that at different times, Strava has used different file types to store recordings of users' activities. For each activity, there was always a gpx file, but then there was also either a fit file, or a json file. I'm still not sure what these different files are for. For example, it seems the gpx files have elevation data gathered from one's phone's elevation measurements, while the fit/json files have elevation data based on... map data computed after the fact? To be honest, I'm not sure of anything here except that the two elevation readings do not match.
2 - Reading Data in R
One nice feature of R is that its users have made packages for reading all sorts of file formats. Thankfully, I was quick to find packages for JSON, GPX, and FIT filetypes. Not so thankfully, at different times in Strava's history, they decided to keep track of different types of data, so I had to do quite a bit of massaging to get clean, consistent data from all of my individual runs. I ended up recalculating all distances based on the latitude and longitude measurements, and got rid of several types of data (gps accuracy, one of the elevation datas mentioned in the previous section, etc).
`2.5 - RunnerUp and the Curse of Data Wrangling
Around the time that I started working on this project, I also decided to stop using Strava and instead switch to an open source alternative called RunnerUp. I immediately ran into a couple problems. First, RunnerUp only stores GPX files. This meant I had to write a new condition for what to do with activities that don't have the additional information from JSON/FIT files. Second, the RunnerUp GPX files are formatted slightly differently than the Strava ones, so I had to make new cases for them as well. Third, the GPX reader package I was using abruptly stopped being supported, so I had to change all of my code to use the new replacement package. But form some reason, this package had trouble specifically with some of the GPX files generated by RunnerUp, so I had to write an additional case for when it failed, using an XML reader package and writing more code to get the specific data I needed. None of this took too many lines of code to write, but I learned how much of a pain it is to wrangle data of various formats together. All of the online tutorials really kid their readers into thinking massaging data is the easy bit and the analysis is the more difficult part, but the exact opposite is true.
3 - Finally, Some Math
What I most wanted to see was, given any distance, how fast have I ever run that distance? My algorithm was basically the following:
- For each activity, generate a list of all subsegments' lengths and times.
- For each activity, keep only the "winning segments" which do not have a faster and longer segment in this activity.
- Calculate the segments which do not have a faster and longer segment in any of these winning segments from all other activities.
Here's an example calculation. Let's say on one outing, I ran 3 kilometers. For the first kilometer, I ran at a consistent 4:30/km pace. For the second kilometer, I ran at a consistent 5:30/km pace. Finally, for the third kilometer I sped back up and ran at a 4:00/km pace. My pace graph would look like this:
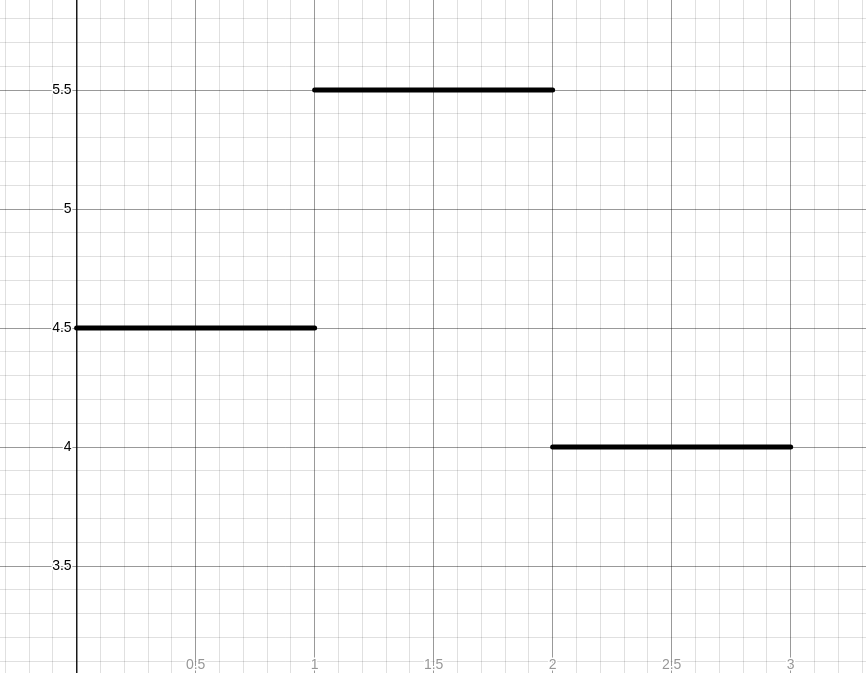
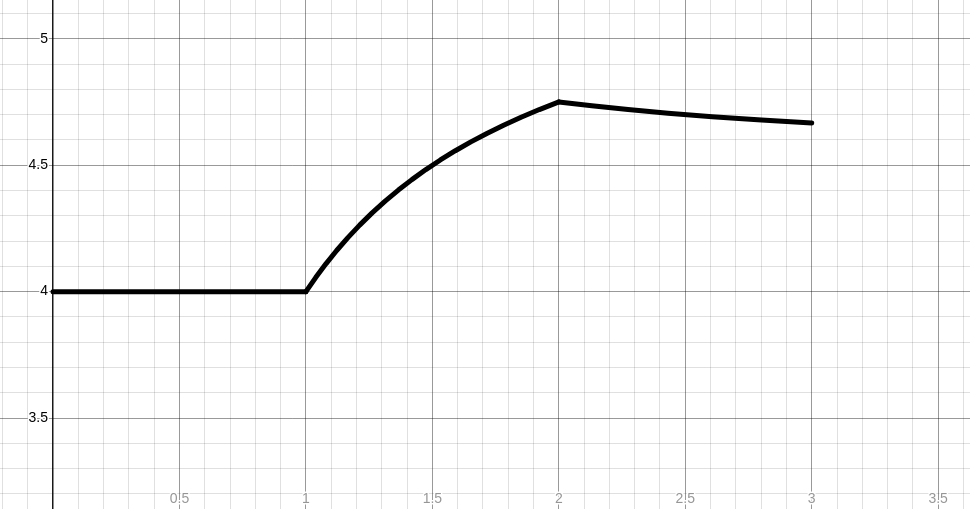
Then, for any given distance, here's what the "winning segments" graph would look like. Note that it does not actually need to be convex, although intuitively we might expect that one's peak performance would be convex.
Conclusion
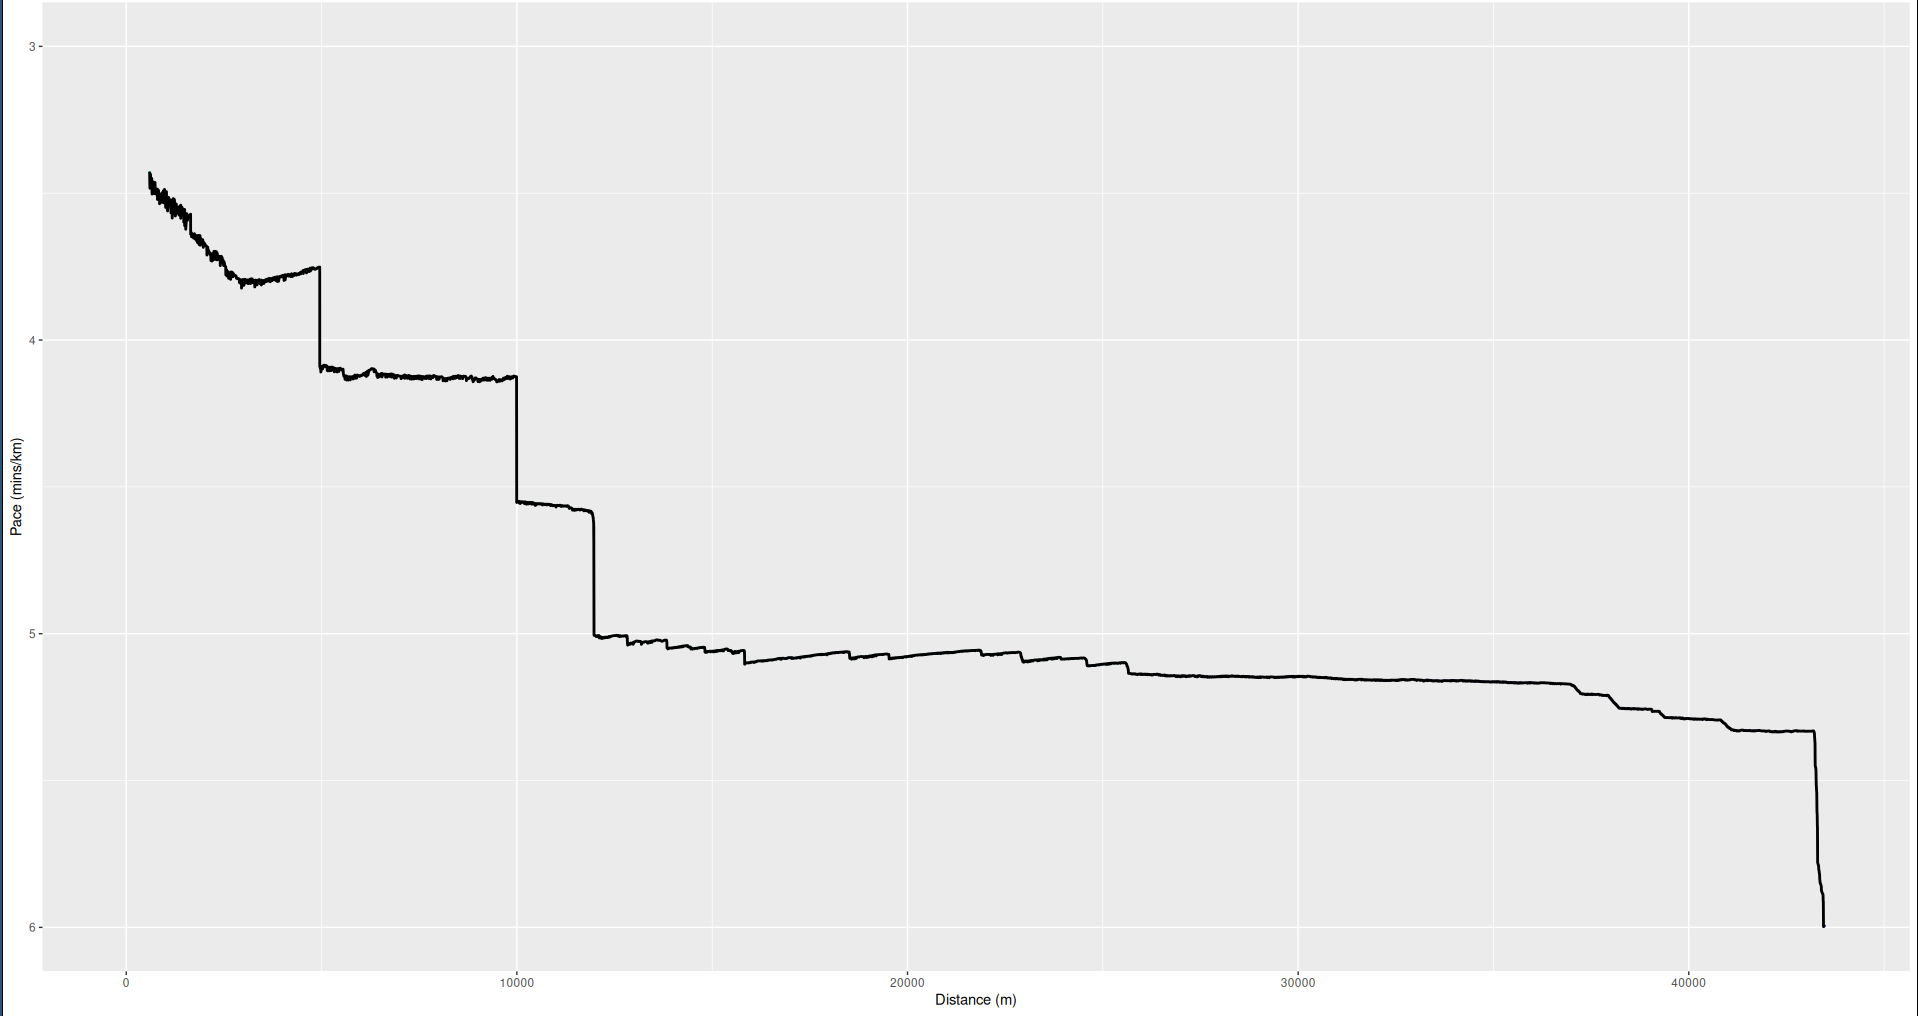
The R code I wrote can be found on my GitHub. Honestly, this type of analysis was much easier than I had expected, and the biggest difficulty was without a doubt just gathering and massaging the data. I will definitely be doing more R analysis on personal data in the future. Below is a graph containing the winning segments of all of the individual runs I used on this project. It's a good motivation for me to try to run nonstandard distances faster. I could probably beat my 6K or 13K time by a lot, for instance, but maybe not my 12K time.